What is Power BI
What is Power BI
Power BI is a business analytics service provided by Microsoft that lets you visualize your data and share insights. It converts data from different sources to build interactive dashboards and Business Intelligence reports.
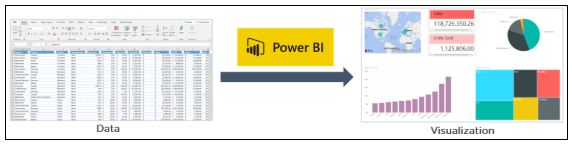
As you see above, we have some sales data in an excel sheet. Using this data, Power BI helps you build different charts and graphs to visualize the data.
Now that you have learned what is Power BI, let us now understand why Power BI is required.
Why Power BI?
Following are the reasons why Power BI is so popular and needed in the BI domain:
1. Access to Volumes of Data from Multiple Sources :
Power BI can access vast volumes of data from multiple sources. It allows you to view, analyze, and visualize vast quantities of data that cannot be opened in Excel. Some of the important data sources available for Power BI are Excel, CSV, XML, JSON, pdf, etc. Power BI uses powerful compression algorithms to import and cache the data within the.PBIX file.
2. Interactive UI/UX Features :
Power BI makes things visually appealing. It has an easy drag and drops functionality, with features that allow you to copy all formatting across similar visualizations.
3. Exceptional Excel Integration :
Power BI helps to gather, analyze, publish, and share Excel business data. Anyone familiar with Office 365 can easily connect Excel queries, data models, and reports to Power BI Dashboards.
4. Accelerate Big Data Preparation with Azure :
Using Power BI with Azure allows you to analyze and share massive volumes of data. An azure data lake can reduce the time it takes to get insights and increase collaboration between business analysts, data engineers, and data scientists.
5. Turn Insights into Action :
Power BI allows you to gain insights from data and turn those insights into actions to make data-driven business decisions.
6. Real-time Stream Analytics :
Power BI will enable you to perform real-time stream analytics. It helps you fetch data from multiple sensors and social media sources to get access to real-time analytics, so you are always ready to make business decisions.
Components of Power BI
Power Query :
Power Query is the data transformation and mash up the engine. It enables you to discover, connect, combine, and refine data sources to meet your analysis need. It can be downloaded as an add-in for Excel or can be used as part of the Power BI Desktop.
Power Pivot :
Power Pivot is a data modeling technique that lets you create data models, establish relationships, and create calculations. It uses Data Analysis Expression (DAX) language to model simple and complex data.
Power View :
Power View is a technology that is available in Excel, Sharepoint, SQL Server, and Power BI. It lets you create interactive charts, graphs, maps, and other visuals that bring your data to life. It can connect to data sources and filter data for each data visualization element or the entire report.
Power Map :
Microsoft's Power Map for Excel and Power BI is a 3-D data visualization tool that lets you map your data and plot more than a million rows of data visually on Bing maps in 3-D format from an Excel table or Data Model in Excel. Power Map works with Bing maps to get the best visualization based on latitude, longitude, or country, state, city, and street address information.
Power BI Desktop :
Power BI Desktop is a development tool for Power Query, Power Pivot, and Power View. With Power BI Desktop, you have everything under the same solution, and it is easier to develop BI and data analysis experience.
Power Q&A :
The Q&A feature in Power BI lets you explore your data in your own words. It is the fastest way to get an answer from your data using natural language. An example could be what was the total sales last year? Once you've built your data model and deployed that into the Power BI website, then you can ask questions and get answers quickly.
Now, let's dive into understanding the Power BI features.
Features of Power BI :
Following are some of the features of Power BI
Power BI Desktop :
Power BI Desktop is free software that you can download and install, and it allows you to build reports by accessing data easily. For using Power BI desktop, you do not need advanced report designing, or query skills to build a report.
Stream Analytics :
Power BI's primary advantage is its support stream analytics. From factory sensors to social media sources, Power BI assists in real-time analytics to make timely decisions.
Multiple Data Sources :
Support for various data sources is one of the vital features of Power BI. You can access various sources of data such as Excel, CSV, SQL Server, Web files, etc. to create interactive visualizations.
Custom Visualization :
While dealing with complex data, Power BI's default standard might not be enough in some cases. In that case, you can access the custom library of visualization that meets your needs.
Conclusion :
After reading this article, you would have understood the need for Power BI in Business Intelligence, what is Power BI, and the various features of Power BI. You also learned about Power BI Service, how to create a Dashboard in Power BI, Finally, you explored the different features of Power BI Desktop by creating different visualizations to analyze finance sample data.


Comments
Post a Comment